The default reasoning for adding a battery to a clipping-heavy solar plant is intuitive: the plant throws away energy at the grid limit, so store it and sell it later. On a 125.2 MWp plant with a 50 MWe point-of-interconnection limit, that reasoning produced a battery with negative NPV. The battery only paid for itself once ancillary-service revenue was added to the model.
This is not an argument against storage. It is an argument for modeling clipping, the DC/AC ratio, and the revenue stack together, before sizing anything. The study compared fixed-tilt and single-axis tracker configurations on the same plant, same inverters, same battery, designed and costed in PVX.Cad against PVsyst simulation.
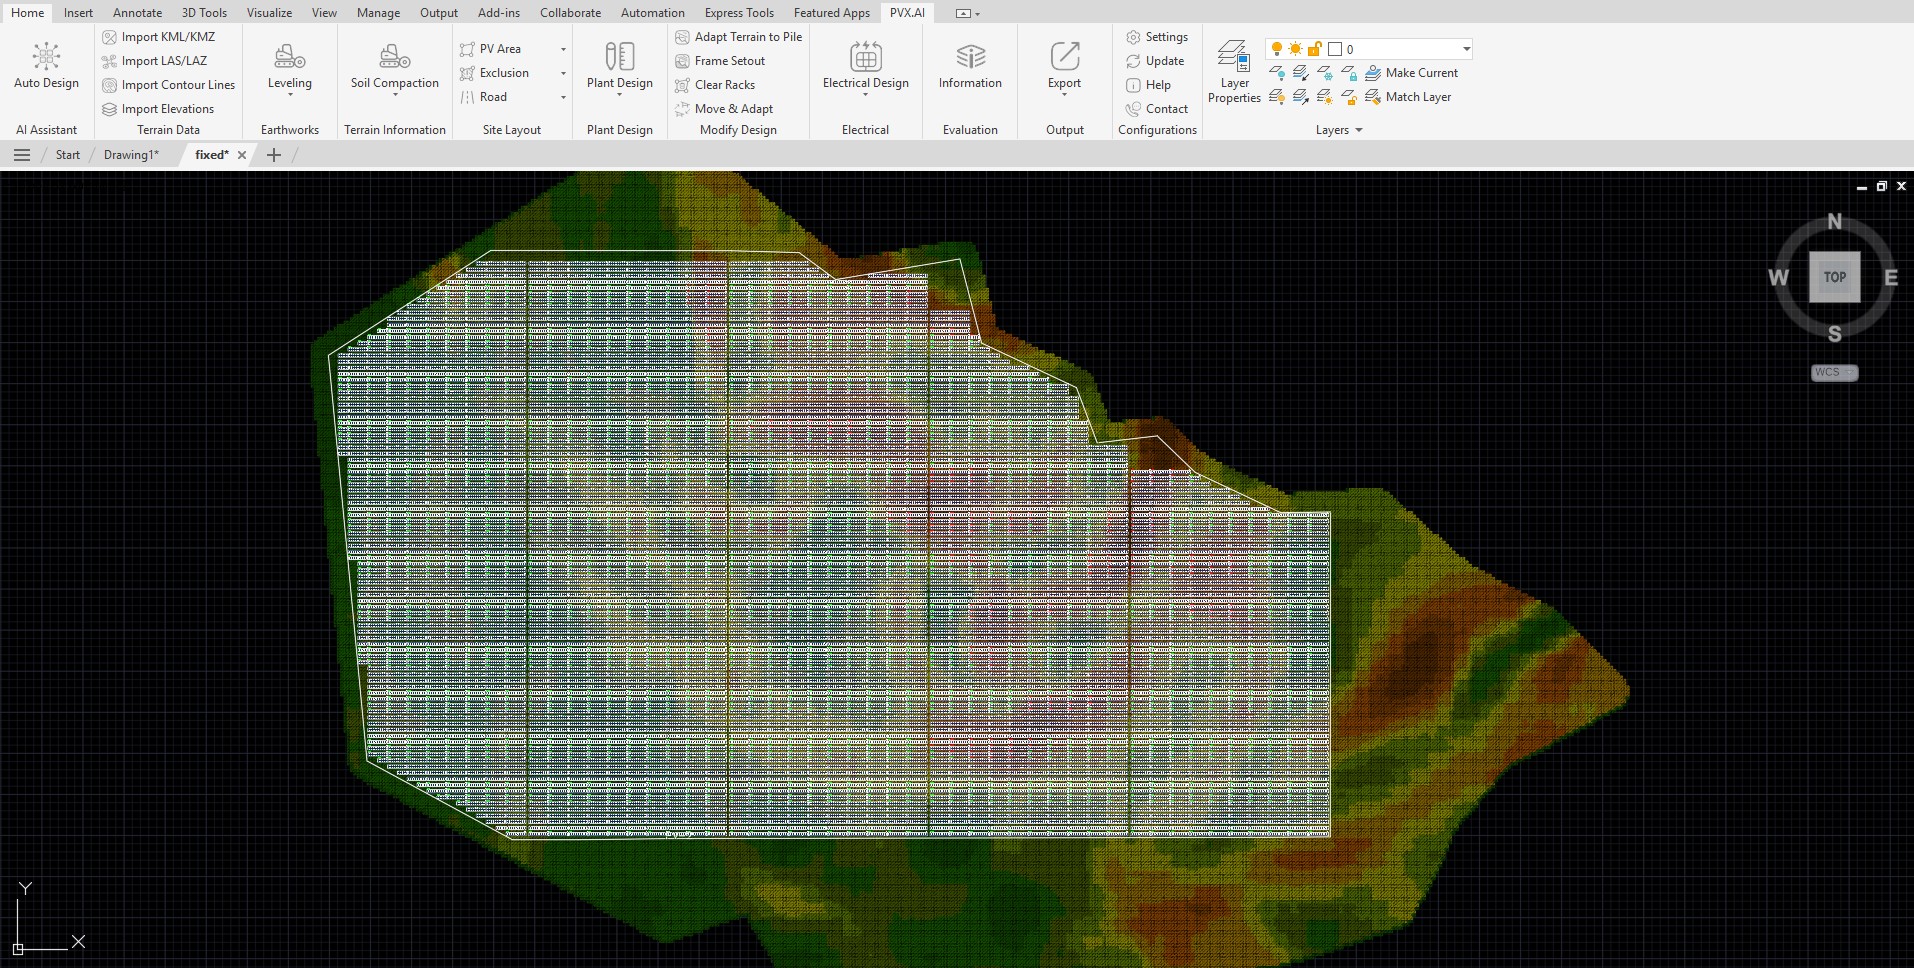 Fixed-tilt layout: 1,141,215 m2, ~51.2 percent GCR, ~170 kWh/m2/yr. More compact, lower clipping.
![]() Single-axis tracker layout: 1,918,912 m2 (68 percent more land), ~32.3 percent GCR. More energy, but more clipping and more cabling.
Single-axis tracker layout: 1,918,912 m2 (68 percent more land), ~32.3 percent GCR. More energy, but more clipping and more cabling.
Clipping Is a Design Output, Not an Accident
Both configurations used the same 84.38 MWac of inverters. But the DC input behaves differently. Trackers deliver higher plane-of-array irradiance, so inverters sit at their nominal AC ceiling longer:
| Metric | Fixed-Tilt | Tracker |
|---|---|---|
| Hours at nominal AC output | ~1,280/yr | ~1,710/yr |
| Inverter clipping loss | 2.9% (~6.0 GWh/yr) | 5.0% (~12.5 GWh/yr) |
| Array energy at MPP | 208.39 GWh | 249.84 GWh |
Clipping on the tracker is 72% higher. That is not only lost production. It raises thermal load on the inverters and increases DC and AC cable ohmic losses, because the system runs at full output more often. Higher clipping is a predictable consequence of a high DC/AC ratio (1.48 here), not a surprise. The design question is how much clipping is acceptable, and how much of it a battery can actually recover.
The AC-Coupled Catch
Both systems were fitted with the same AC-coupled BESS: 74 units of ST5015kWh-1250kW, LFP chemistry, 20% minimum state of charge, 83.5 MW maximum charge/discharge, about 307,854 kWh stored, and an 88.5% round-trip efficiency. Annual discharge:
| Metric | Fixed-Tilt | Tracker |
|---|---|---|
| Annual battery discharge | 7.371 GWh/yr | 11.451 GWh/yr |
| Battery contribution | 6.4% | 7.4% |
Here is the catch. In an AC-coupled architecture, clipping occurs on the DC side of the inverter. Energy already lost to clipping cannot be fully captured by a battery sitting on the AC side. So the battery’s value does not come from “recovering clipped energy” in the simple sense. Its real value drivers are POI-limit curtailment recovery, energy arbitrage, and ancillary services. Assume otherwise and the financial model overstates the battery’s contribution.
The battery also has a finite life. At this duty cycle, BESS life was estimated at about 9.9 years, so a 20-year financial model must carry at least one battery replacement.
The Number That Decides It
Run the discounted cash flow (20 years, 8% real discount, 0.5%/yr degradation, 82.6 USD/MWh) and the battery’s standalone case collapses. Peak shaving alone produced negative NPV in both configurations. The break-even came only from ancillary-service revenue:
- Fixed-tilt: NPV-neutral at roughly 39,000 USD/MW-year of ancillary revenue.
- Tracker: NPV-neutral at roughly 27,000 USD/MW-year.
Below those thresholds, every MWh the battery cycles loses money. The financial table makes the pattern visible across BESS sizes:
| Configuration | BESS (MWh) | CAPEX (M USD) | NPV (M USD) | IRR |
|---|---|---|---|---|
| Fixed-tilt | 0 | 103.4 | 29.4 | 11.7% |
| Fixed-tilt | 40 | 112.9 | 21.6 | 10.6% |
| Fixed-tilt | 80 | 122.4 | 8.1 | 8.9% |
| Tracker | 0 | 118.6 | 34.8 | 11.8% |
| Tracker | 40 | 128.0 | 29.6 | 11.1% |
| Tracker | 80 | 137.5 | 16.8 | 9.6% |
Every increment of battery adds CAPEX and pulls NPV and IRR down, unless a revenue stream beyond peak shaving fills the gap. The 80 MWh case is the clearest: on the tracker it adds 18.9M USD in CAPEX and cuts IRR from 11.8% to 9.6%.
Regulation Sets the Revenue, Not the Engineering
The reason peak shaving alone fails is partly regulatory. Under the Turkish storage framework modeled here, the battery is a separate settlement unit, so energy discharged from the BESS to the grid does not qualify for the renewable feed-in support that the PV plant enjoys. Energy drawn from the grid to charge is netted first against the storage unit and is also outside the support scheme. That structure pushes the battery’s round-trip losses straight into OPEX and leaves market price plus ancillary services as the only revenue. Wherever you build, the lesson holds: confirm what the battery is actually allowed to earn before you size it.
How to Size This Correctly
- Treat DC/AC ratio as a constrained optimization, not a max-production target. With a POI limit, size it so clipping lands in a 2 to 4 percent band.
- Verify clipping absorption. Confirm how much clipping a battery can technically capture in your architecture before counting it as recovered revenue. AC-coupled cannot capture DC-side clipping.
- Build the revenue stack first. If ancillary services and arbitrage cannot clear the NPV-neutral threshold (here, 27,000 to 39,000 USD/MW-year), the battery destroys value.
- Carry a replacement. A ~9.9-year battery life means a 20-year model needs at least one replacement in CAPEX.
- Decide tracker versus fixed on the whole picture. The tracker produced more energy and a higher NPV at every BESS size, but it also carries more clipping, wider site spread, higher cabling cost, and more mechanical O&M risk. Production alone is not the decision.
The plant decision should never be reduced to “the tracker produces more.” Optimize the DC/AC ratio against clipping and regulation, size the battery to a real revenue stack, then weigh tracker against fixed on technical, financial, and operating risk together. PVX.Cad models the layout, clipping behavior, and civil cost on one terrain-aware model, so the trade-offs are visible before the configuration is locked.