PVX.View
Visualize and share
solar designs in the browser
PVX.View is the Three.js-powered visualization and sharing product of the PVX.AI platform. One click in PVX.Cad publishes the design to a shareable browser link with interactive 3D terrain and equipment, sun and shadow simulation, a shadow-intensity heatmap, point-cloud display, and recorded flyovers for stakeholders.
Last updated:
Interactive 3D Visualization
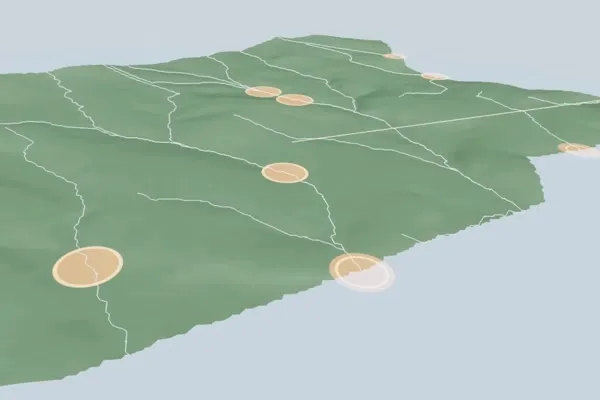
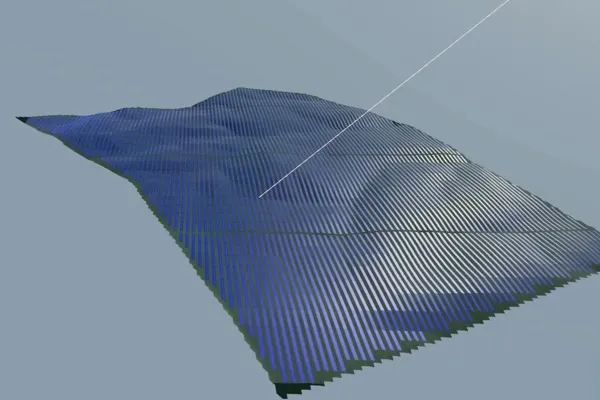
PVX.View shows the full solar site in 3D from a single shared link: terrain elevation, tilted panels, roads, cable routes, and equipment.
- Rotate, zoom, and fly through the design from any angle
- Adjustable sun position by date and time
- Terrain, panels, roads, DC and AC cables, and equipment in one scene
- Works on desktop, tablet, and mobile with no install
Sun and Shadow Simulation
PVX.View visualizes how shadows move across the site through the day and the year, directly on the 3D terrain.
- Set the sun by date and time to see live shadow patterns
- Analyzer Heatmap builds a shadow-intensity map across tables
- Review inter-row shading before it reaches the field
- Shadows update as you move the sun
Terrain and Point Cloud Display
PVX.View lets you inspect the site surface and the source survey data behind it.
- Toggle the terrain surface on and off
- Display 3D point cloud data from the original survey
- Change surface and table colors for clarity
- Compare the design against the raw ground it sits on
Render and Video
PVX.View turns a design into a shareable animation for presentations, recorded in the browser.
- Keyframe recording: capture camera viewpoints, render a smooth transition
- Flyover recording along a route you draw on the model
- Download the result as a WebM video
- Useful for investor and client presentations
Stakeholder Sharing
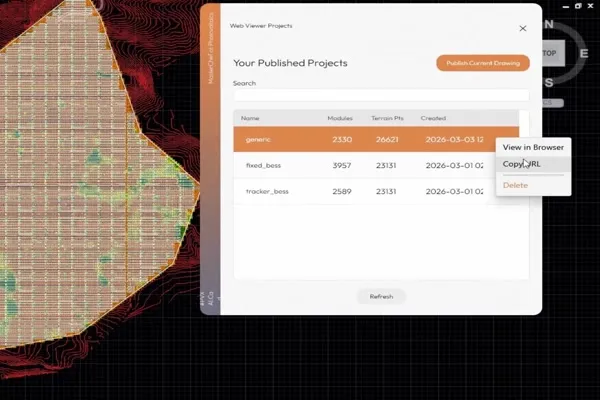
PVX.View publishes from PVX.Cad in one click, so developers, investors, and construction teams open the design without AutoCAD.
- One-click publish from PVX.Cad creates a unique URL
- Anyone with the link can view, with no account or download
- Opens in any browser, or in the built-in PVX browser
- Share the same 3D design with every stakeholder
What PVX.View delivers
Need a comprehensive assessment of the completed design?
PVX.View visualizes and shares the design. For P50/P90 energy yield, loss analysis, BESS results, and financial metrics, submit the completed PVX.Cad project separately to PVX.Assess. The queued report can take up to 30 minutes to generate.
Explore PVX.Assess →Frequently asked questions
Do stakeholders need to install anything to view a design?
No. PVX.View opens in any browser from a shared link, with no account and no download. You publish once from PVX.Cad, and anyone with the link explores the interactive 3D model on desktop, tablet, or phone.
How does the shadow view work in PVX.View?
Adjust the sun by date and time to watch shadows move across the site. The Analyzer Heatmap produces a shadow-intensity map showing how shadows fall across tables at different times and dates, which supports inter-row shading review.
Can PVX.View record a flythrough video?
Yes. Add keyframes by positioning the camera, and PVX.View renders a smooth transition between them for download as a WebM video. You can also record a flyover along a route you draw on the model, which is useful for investor presentations.
What can I see in the PVX.View viewer?
The full 3D site: terrain surface, tilted panels, roads, DC and AC cables, and equipment. You can toggle the terrain surface, display 3D point cloud data, and change surface and table colors.
Where do yield and financial reports come from?
Submit the completed PVX.Cad design to PVX.Assess for energy yield, financial analysis, and the PDF assessment report. PVX.View is dedicated to browser-based 3D visualization, shadow review, and sharing.
See PVX.View in action
Book a demo. We publish a live design to a shareable link and walk through 3D visualization, shadow analysis, and flyover recording.