The Challenge
The tracker vs. fixed-tilt decision is typically framed as an energy yield question. On flat ground, trackers win on production and the analysis ends there.
On complex terrain, the decision is fundamentally different. Trackers require more land, more earthwork, longer cable runs, and different pile strategies. These civil cost differences can offset the energy advantage, especially on steep or rocky sites.
This study compared both configurations on the same 125.2 MWp plant (Kayseri, Turkey), with identical DC/AC ratio (1.48), identical inverter capacity (84.38 MWac), and identical 50 MWe POI limit. AC-coupled BESS with peak shaving was analyzed across both configurations.
Design Criteria
- DC Installed Power: 125.2 MWp
- AC Inverter Capacity: 84.38 MWac
- DC/AC Ratio: 1.48 (fixed for both scenarios)
- POI Limit: 50 MWe (grid injection cap)
- BESS: AC-coupled, LFP technology, peak shaving strategy
- Climate Data: PVGIS 5.2 TMY (Kayseri, Turkey)
- Standards: IEC 62548, IEC 60364-7-712, IEC 60287, IEEE 1547, IEC 62109
Layout Comparison
 Fixed-tilt configuration: 1,141,215 m2 at ~51.2 percent GCR.
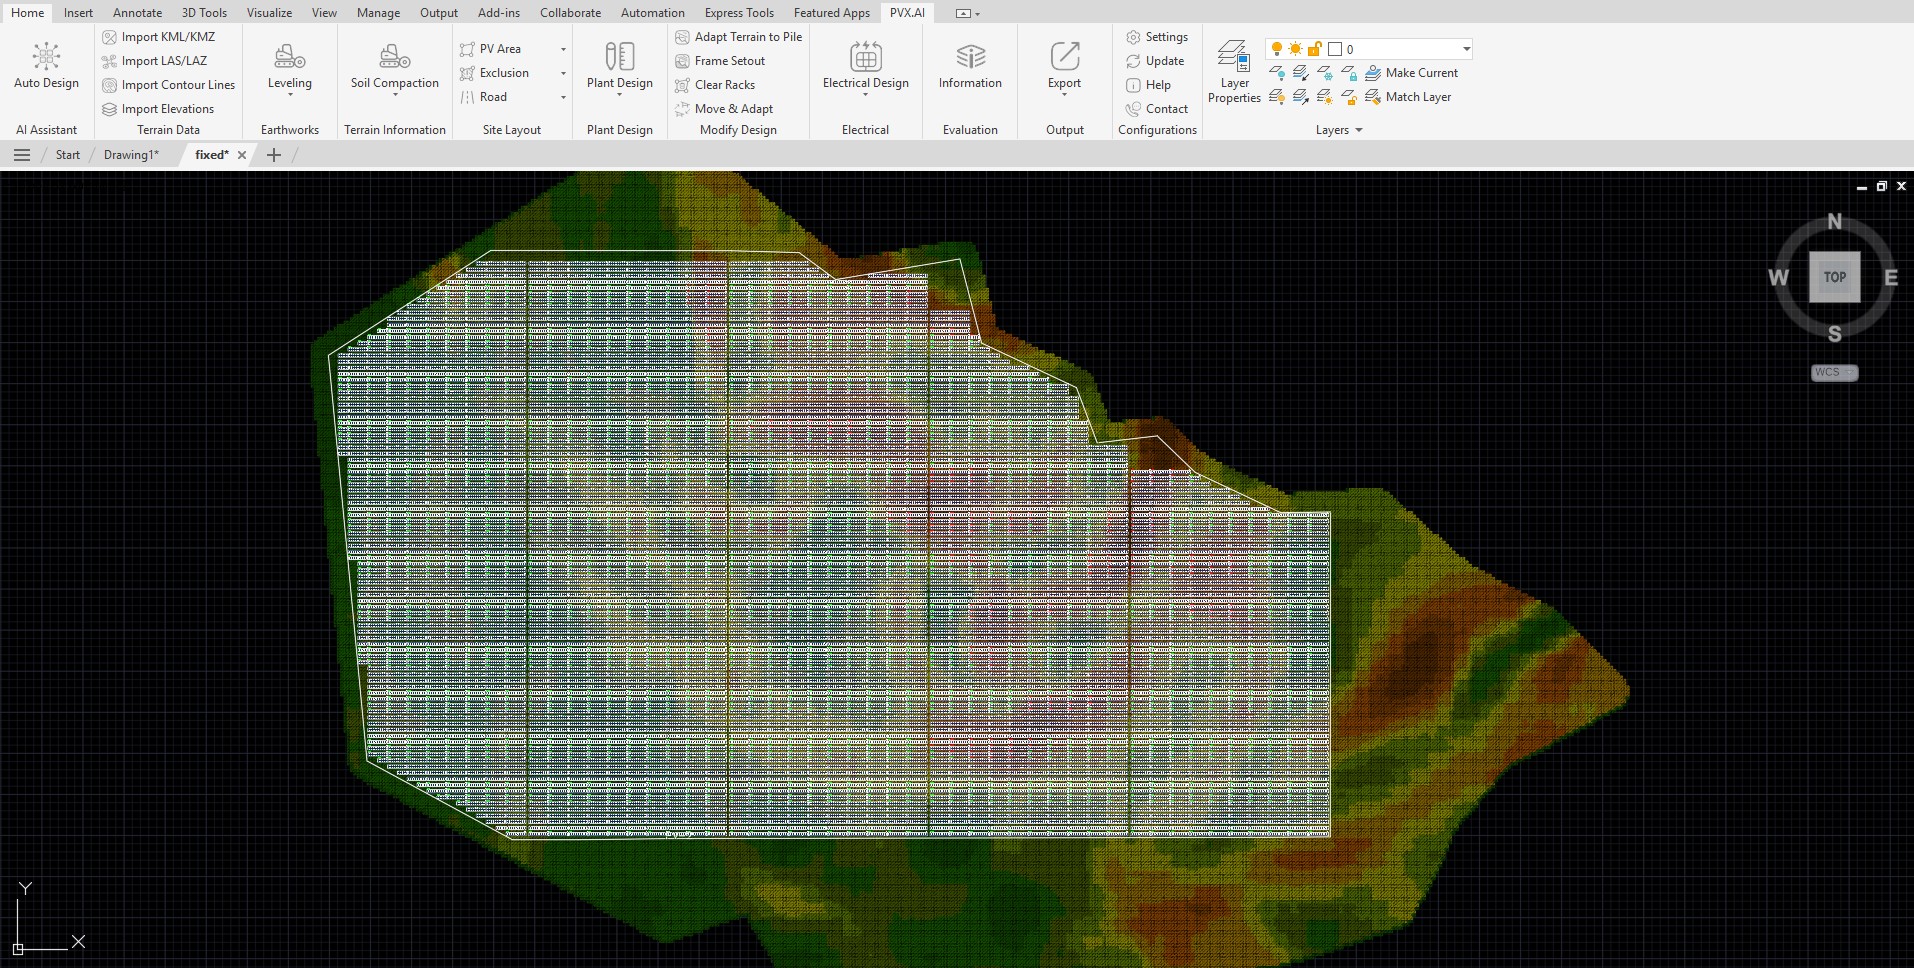
![]() Single-axis tracker configuration: 1,918,912 m2 at ~32.3 percent GCR, 68 percent more land for the same DC capacity.
Single-axis tracker configuration: 1,918,912 m2 at ~32.3 percent GCR, 68 percent more land for the same DC capacity.
PVX.Cad modeled both configurations on the same terrain:
| Parameter | Fixed-Tilt | Tracker | Delta |
|---|---|---|---|
| Total land area | 1,141,215 m2 | 1,918,912 m2 | +68% |
| Average GCR | 51.2% | 32.3% | -37% |
| Energy per m2 | 170 kWh/m2/yr | 118 kWh/m2/yr | -31% |
Fixed-tilt achieves higher energy density per unit of land. Tracker requires 68% more land area for the same DC capacity due to wider row spacing required by the tracking mechanism.
Earthwork Analysis
| Parameter | Fixed-Tilt | Tracker | Delta |
|---|---|---|---|
| Earthwork volume | 324,000 m3 | 575,000 m3 | +77.5% |
| Earthwork density | 0.284 m3/m2 | 0.300 m3/m2 | +6% |
| Earthwork per GWh | 1,666 m3/GWh | 2,530 m3/GWh | +52% |
Tracker requires 77.5% more total earthwork volume. The increase comes from two sources: larger land area requiring preparation, and the terrain adaptation required for tracker row alignment on slopes. Earthwork intensity per GWh produced is 52% higher for the tracker configuration.
Pile and Racking Analysis
| Parameter | Fixed-Tilt | Tracker | Delta |
|---|---|---|---|
| Total pile metrage | 231,491 m | 191,891 m | -17% |
Despite using 68% more land, the tracker configuration uses 17% less total pile metrage. Fixed-tilt systems use 2x13 and 2x26 rack configurations with direct load transfer to ground. Tracker systems are structurally lighter per unit. Pile metrage is not proportional to area. Topography and grading strategy are the determining factors.
Cable and Electrical Infrastructure
The tracker layout’s 68% larger footprint directly increases cable trench lengths, fill volumes, and cable labor. On-site cable metrage is estimated to increase by 25-30% in the tracker scenario. This increase reflects directly in electrical CAPEX.
Inverter Loading and Clipping
Both configurations use the same 84.38 MWac inverter capacity, but DC input characteristics differ:
| Parameter | Fixed-Tilt | Tracker |
|---|---|---|
| Hours at nominal AC output | ~1,280/yr | ~1,710/yr |
| Inverter clipping loss | 2.9% (~6.0 GWh/yr) | 5.0% (~12.5 GWh/yr) |
Tracker clipping is 72% higher because tracker systems deliver higher plane-of-array irradiance, pushing inverters into clipping for more hours per year. This is not just a production loss. Higher clipping increases thermal load on inverters and DC/AC cable ohmic losses.
AC-Coupled BESS and Peak Shaving
Both systems were fitted with identical BESS configuration: 74 units ST5015kWh-1250kW, LFP technology, minimum 20% SOC, maximum 83.5 MW charge/discharge power, ~307,854 kWh stored energy, 88.5% round-trip efficiency. At this duty cycle, BESS life is estimated at ~9.9 years, so a 20-year financial model must carry at least one battery replacement.
| Parameter | Fixed-Tilt | Tracker |
|---|---|---|
| Annual battery discharge | 7.371 GWh/yr | 11.451 GWh/yr |
| Battery contribution | 6.4% | 7.4% |
The tracker scenario generates more curtailed energy due to higher clipping, giving BESS more opportunity for peak shaving. Battery discharge is 55% higher in the tracker configuration.
BESS Sizing Options
| Target BESS (MWh) | Containers | Nominal Energy (MWh) | 2h Power (MW) | 4h Power (MW) |
|---|---|---|---|---|
| 10 | 2 | 10.03 | 5.0 | 2.5 |
| 20 | 4 | 20.06 | 10.0 | 5.0 |
| 40 | 8 | 40.12 | 20.0 | 10.0 |
| 80 | 16 | 80.24 | 40.0 | 20.0 |
Annual Production
| Configuration | Annual Production | Specific Yield |
|---|---|---|
| Fixed-Tilt | 194,430 MWh | 1,553 kWh/kWp |
| Tracker | 227,290 MWh | 1,816 kWh/kWp |
| Delta | +32,860 MWh | +16.9% |
Financial Summary
| Parameter | Fixed-Tilt | Tracker | Delta |
|---|---|---|---|
| CAPEX (no BESS) | $103.4M | $118.6M | +15% |
| NPV (no BESS) | $29.4M | $34.8M | +18% |
| IRR (no BESS) | 11.7% | 11.8% | ~same |
BESS Impact on Tracker Economics
| BESS Size | CAPEX | NPV | IRR |
|---|---|---|---|
| 0 MWh | $118.6M | $34.8M | 11.8% |
| 10 MWh | $121.0M | $32.1M | 11.5% |
| 40 MWh | $128.0M | $29.6M | 11.1% |
| 80 MWh | $137.5M | $16.8M | 9.6% |
BESS adds curtailment recovery but at diminishing returns. The 80 MWh configuration adds $18.9M in CAPEX while reducing IRR from 11.8% to 9.6%. The NPV-positive BESS sizing depends on local electricity market prices, ancillary service revenue, and regulatory framework.
Storage Economics: Why Peak Shaving Alone Is Not Enough
Run the discounted cash flow (20 years, 8% real discount, 0.5%/yr degradation, 82.6 $/MWh) and the battery’s standalone case collapses. Peak shaving alone produced negative NPV in both configurations. The break-even came only from ancillary-service revenue:
| Configuration | NPV-neutral ancillary revenue |
|---|---|
| Fixed-Tilt | ~$39,000/MW-year |
| Tracker | ~$27,000/MW-year |
Below those thresholds, every MWh the battery cycles loses money. Two mechanisms explain it. First, in an AC-coupled architecture the clipping happens on the DC side of the inverter, so a battery on the AC side cannot capture energy already lost to clipping. The battery’s real value drivers are POI-limit curtailment recovery, energy arbitrage, and ancillary services, not raw clipping recovery. Second, regulation sets the revenue: under the Turkish storage framework modeled here, the BESS is a separate settlement unit, so energy it discharges to the grid does not qualify for the renewable feed-in support the PV plant enjoys, and charging energy is netted first against the storage unit. Round-trip losses go straight into OPEX.
The design implication: with a POI limit, the DC/AC ratio is no longer a max-production target. Size it so clipping lands in a 2 to 4 percent band, verify how much of that clipping the battery can actually absorb, and confirm the revenue stack clears the NPV-neutral threshold before committing to a battery size.
Key Findings
- Tracker produces 16.9% more energy (227,290 vs 194,430 MWh/yr) on the same site.
- Tracker requires 77.5% more earthwork (575,000 vs 324,000 m3).
- Tracker uses 68% more land but 17% less pile metrage due to lighter structural design.
- Inverter clipping is 72% higher in tracker (5.0% vs 2.9%) due to higher POA irradiance.
- BESS discharge is 55% higher in tracker (11.45 vs 7.37 GWh/yr) because more energy is curtailed.
- IRR is nearly identical (11.8% vs 11.7%) without BESS, despite tracker’s 15% higher CAPEX.
- BESS reduces tracker IRR from 11.8% to 9.6% at 80 MWh. Sizing must be justified by revenue model.
- Terrain determines the crossover. On steep terrain above 35% slope, fixed-tilt’s civil cost advantage outweighs tracker’s energy advantage.
- A hybrid approach (tracker on lower slopes, fixed-tilt on ridge areas) captured 94% of tracker energy at 78% of tracker civil cost.
- Both configurations were designed, compared, and costed in a single AutoCAD session using PVX.Cad.
- Peak shaving alone produces negative NPV. The battery turns NPV-neutral only with ~$39,000/MW-year (fixed-tilt) or ~$27,000/MW-year (tracker) of ancillary-service revenue. Size storage to a real revenue stack, not to curtailment recovery alone.
- DC/AC ratio is a constrained decision under a POI limit. Target a 2 to 4 percent clipping band and verify how much clipping an AC-coupled battery can actually absorb, since DC-side clipping cannot be captured on the AC side.