A solar layout can be complete in every drawing sense and still fail in the ground. The rows are placed, the strings are drawn, the cable schedule is out for pricing. Then the pile rig reaches the north slope and the first pile comes up short of its reveal band. The next one is fine. The one after that needs a longer pile that nobody ordered.
Those discoveries happen at field rates: a rig crew standing by, a structural reviewer on the phone, a change order taking shape. Collision Analysis in PVX.Cad exists to make the same discoveries in AutoCAD, weeks earlier, and then to fix them with the least ground moved.
This post walks through one run on a sample project: 534 tracker racks on real terrain, scanned, fixed, and re-scanned. Every number below is read off the screen.
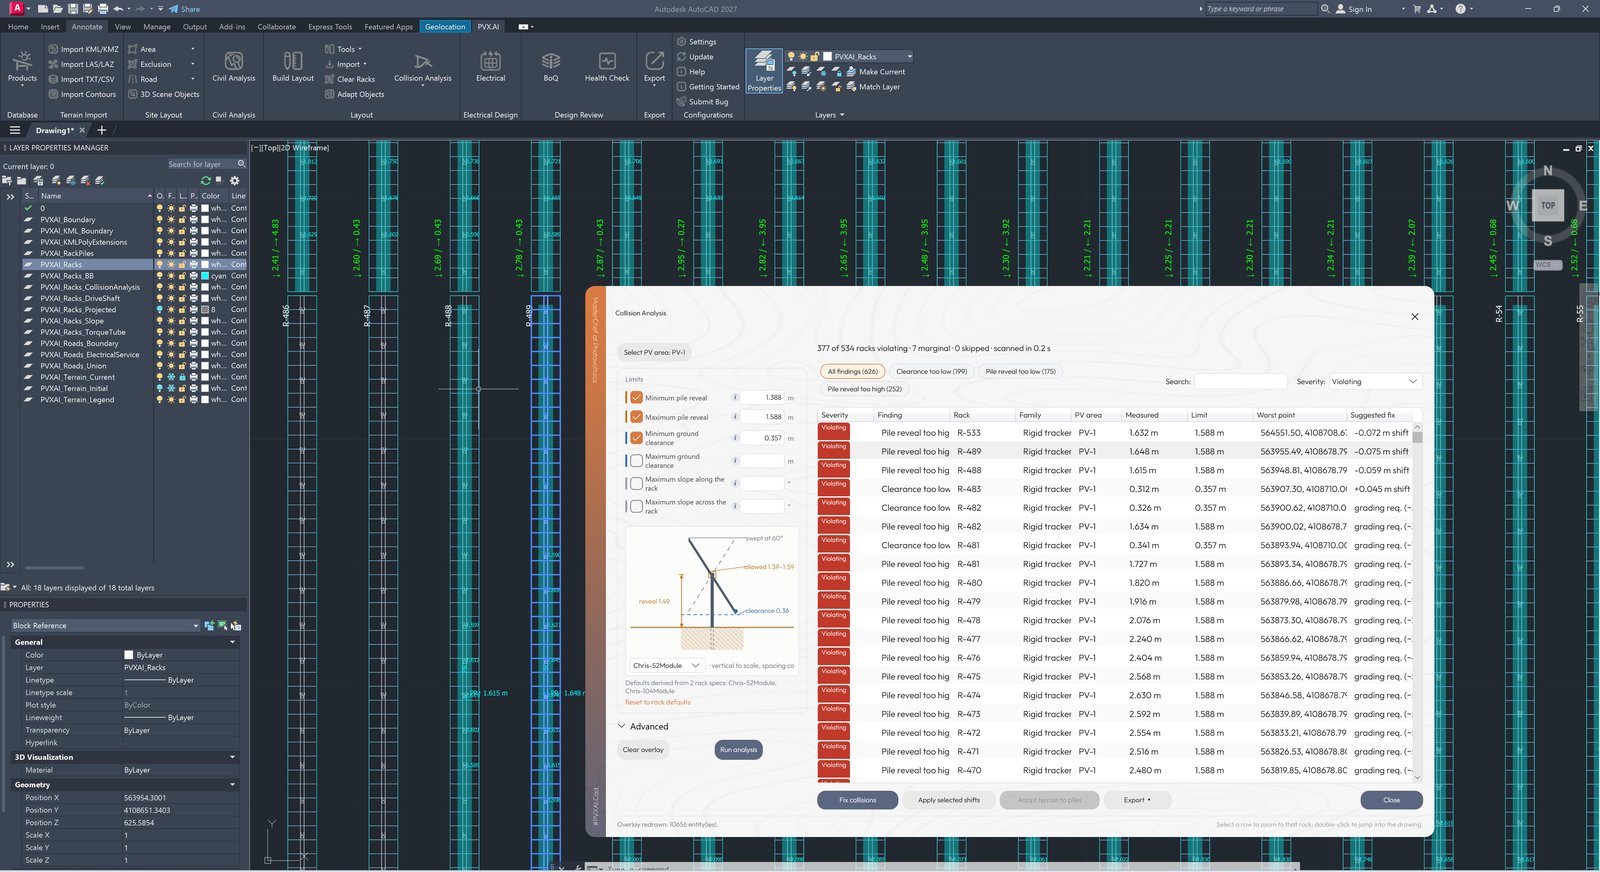
The drawing after a scan. Violating rows carry badges and per-pile labels, and the findings grid sits beside them ranked worst first.
What “collision” means here
This is not the rack-to-rack overlap check. That older check still runs during 2D-to-3D conversion, where tables over the slope limit are not converted and tables that intersect after projection are highlighted. Collision Analysis is about each rack against the terrain it stands on.
Four words, once. Rack, table, racking (US), or module mounting structure, MMS (India): the same steel. Pile: the driven post that holds it. Pile reveal: what is left of a fixed-length pile above ground after embedment. Ground clearance: the gap between the module’s low edge and the ground.
Three things are measured per rack:
- Pile reveal against the spec’s reveal band. Too short and the module edge drops toward the ground; too long and you are buying a pile that was never in the schedule.
- Ground clearance along the structure’s underside, not only at the pile positions. A hill or a ditch between two piles is caught, because that is where the module edge actually meets the ground.
- Slope limits along and across the rack, as directional limits. Available in the limits pane; not enabled in the run below.
This is the check that compares the design grade to the actual site, rack by rack, before the pile rig does.
Each rack is judged against its own spec. The sample project runs two rigid-tracker specs, Chris-52Module and Chris-104Module, and the defaults in the limits pane are derived from both. A mixed fleet gets mixed limits rather than one blanket rule. Multi-row tracker groups linked by drive shafts are judged and fixed as one unit, because in the field they build as one unit.
The verdicts come from the cloud site design solver, which works from the measured pile heads on the real surface. The judgment reflects the ground the racks will actually stand on, not a flat-plane assumption.
The run: 534 racks in 0.3 seconds
Collision Analysis lives on the Layout panel. Select the PV area (every fix the panel offers acts on one area), click Run analysis, and the header reads back the result:
377 of 534 racks violating, 7 marginal, 0 skipped, scanned in 0.3 s.
That is 626 findings: 199 racks with clearance too low, 175 with pile reveal too low, 252 with pile reveal too high. The limits pane shows what they were judged against: a reveal band of 1.388 to 1.588 m, a ground clearance floor of 0.357 m, and a maximum suggested table shift of 0.500 m.
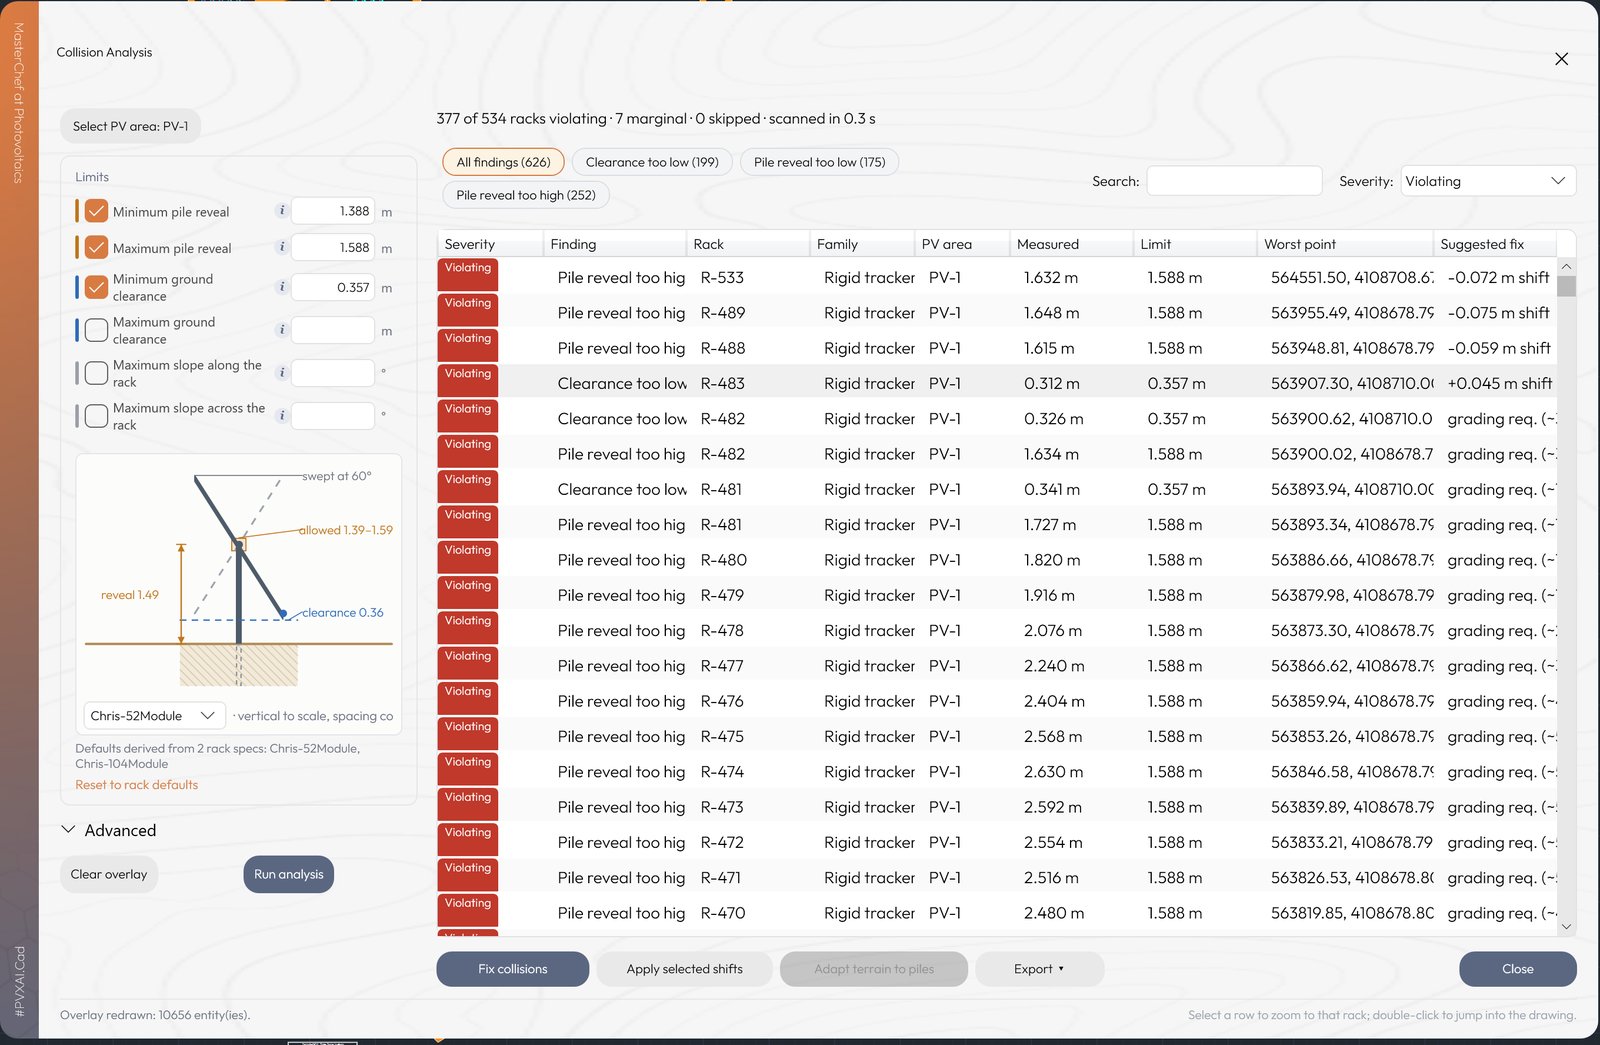
The findings grid. Each row is one rack: what was measured, the limit it broke, where on the rack it broke it, and the cheapest fix that clears it.
The grid is ranked by how far past a limit each rack is, not by the gap to it, so the worst problem is the first row. Read a few rows and the two remedies become visible in the Suggested fix column:
| Rack | Finding | Measured | Limit | Suggested fix |
|---|---|---|---|---|
| R-533 | Pile reveal too high | 1.632 m | 1.588 m | shift -0.072 m |
| R-488 | Pile reveal too high | 1.615 m | 1.588 m | shift -0.059 m |
| R-483 | Clearance too low | 0.312 m | 0.357 m | shift +0.045 m |
| R-481 | Pile reveal too high | 1.727 m | 1.588 m | grading required |
| R-476 | Pile reveal too high | 2.404 m | 1.588 m | grading required |
A rack that is a few centimetres out gets a shift. A rack that is 80 centimetres out needs the ground to change. The grid already knows which is which. Select a row to zoom to that rack; double-click to jump into the drawing.
The drawing tells you where you stand
A scan also leaves a persistent overlay in the drawing: compact badges on violating racks, per-pile reveal labels, and a dated legend so you always know which scan you are looking at. The legend for this run reads 534 scanned, 377 violating, 7 marginal, with the three finding types counted.
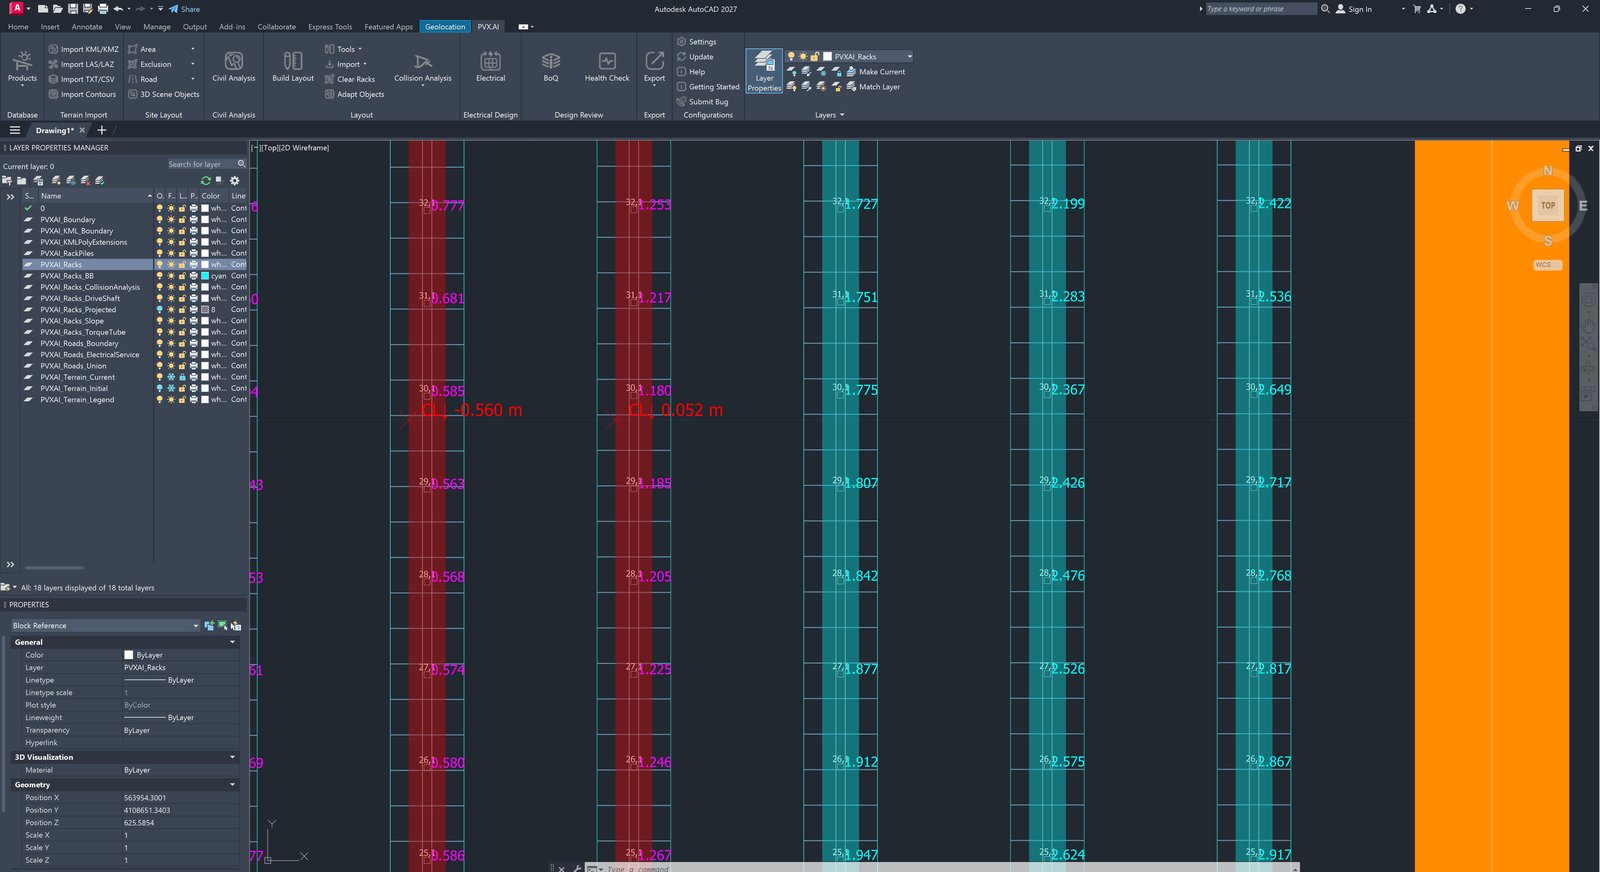
Zoomed in. Every pile carries its reveal, and the failing rows are red. One rack is 0.560 m below the clearance floor at its worst point.
The overlay dismisses itself on any geometry-changing command: move a rack, erase one, paste, or undo, and the badges go, because a verdict for a surface that no longer exists is worse than no verdict. Clear overlay removes it manually.
Fixing, cheapest remedy first
A scan that only produces a punch list still leaves the fixing to you. Collision Analysis classifies every violating rack by its cheapest remedy and offers three ways to apply it, in escalating order.
1. Apply selected shifts
Racks the scan classifies as shift-fixable get a one-click vertical shift: a rigid lift or drop of the whole rack, no ground moved. In this run, shifts of 45 to 75 mm would clear racks R-533, R-489, R-488, and R-483. A multi-row group receives one shared shift so its drive line stays true.
2. Fix collisions, then Run design
Racks a shift cannot save go to the full design pass. The Fix collisions pane states the design numbers it will work to: pile reveal 1.488 m, allowed reveal 1.388 to 1.588 m, minimum ground clearance 0.36 m, pile embedment 1.50 m from the spec. Two options sit below: grade the terrain first to target slopes, and limit earthwork per pile and rack lift.
Then it says, in plain words, what will happen: it lifts each rack rigidly where that reaches the band and the floor, and grades only under the piles and edges that still miss. Read that last clause carefully, because it is not pile-by-pile grading. A bulldozer does not cut in 50 cm steps, and a slope carved into a pocket under every pile is a drawing the contractor cannot build. The pass reshapes the ground under those rows as one continuous surface, with the least cut and fill that brings every rack inside its band, and it holds the rest of the site still. It also gives an estimate before you commit. For this area: about 40,655 m³, labelled “order of magnitude, not a take-off.”
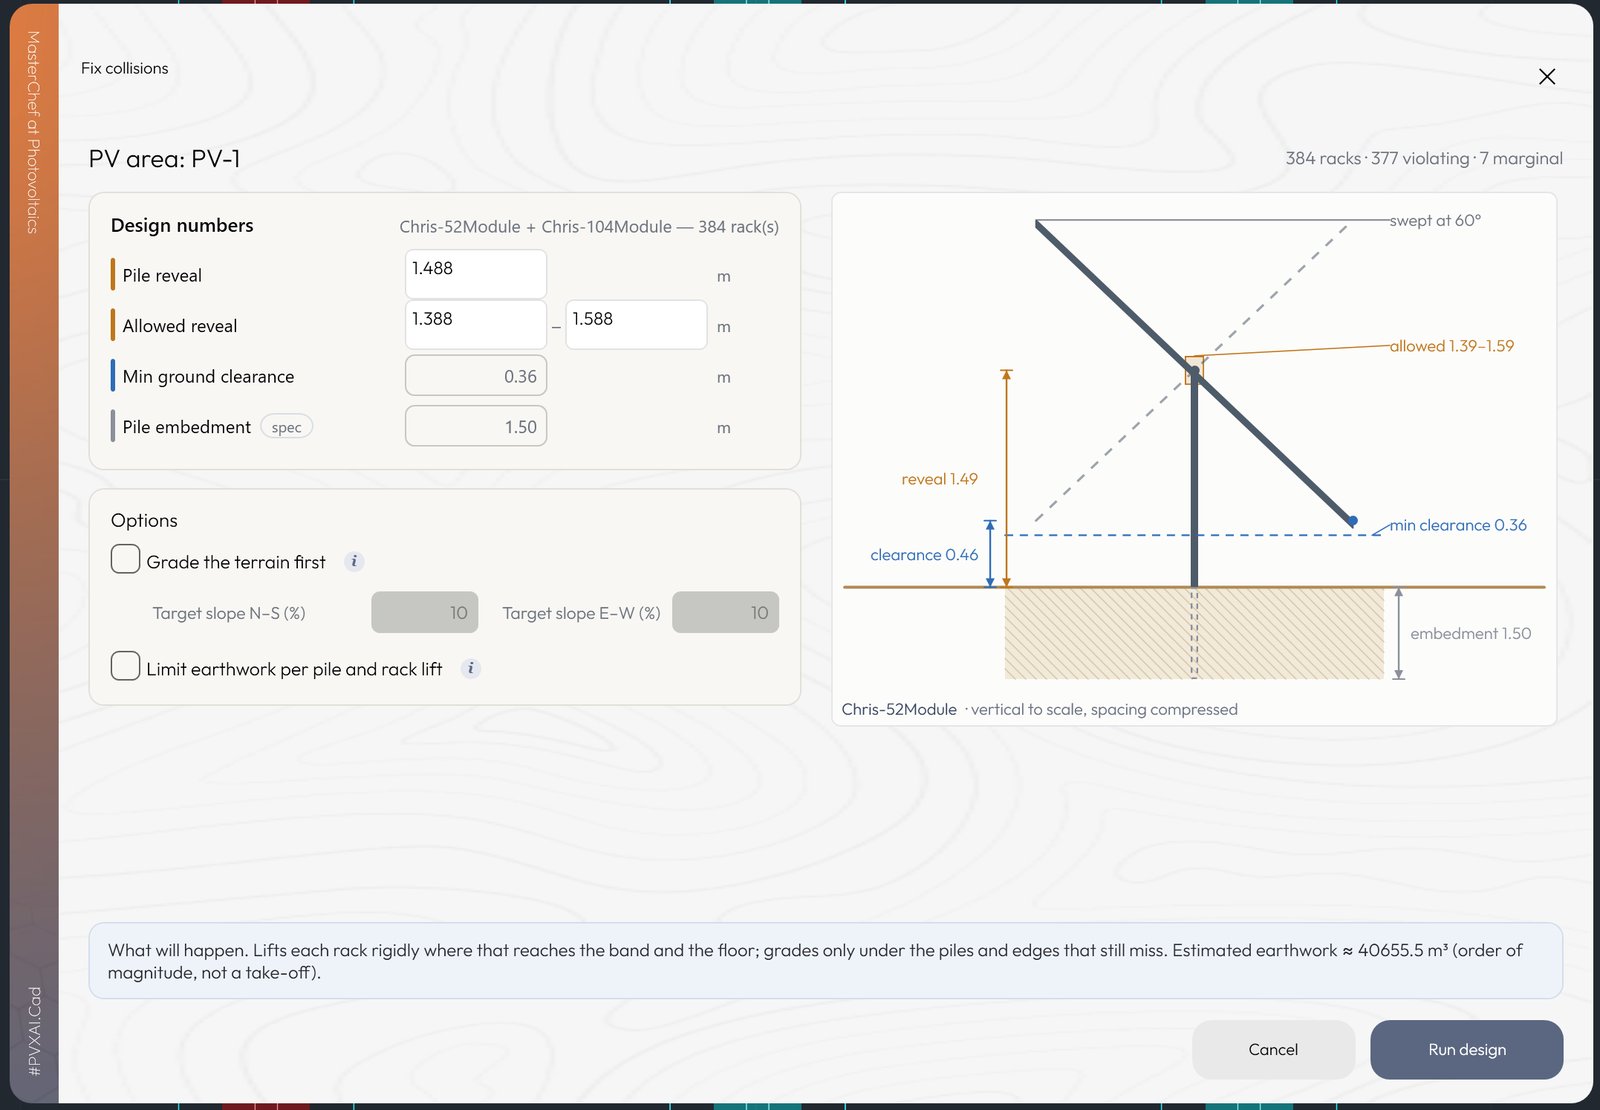
Before anything moves: the numbers the pass will work to, the options, and an honest estimate of the earthwork it expects.
Run design, and the result comes back as one sentence:
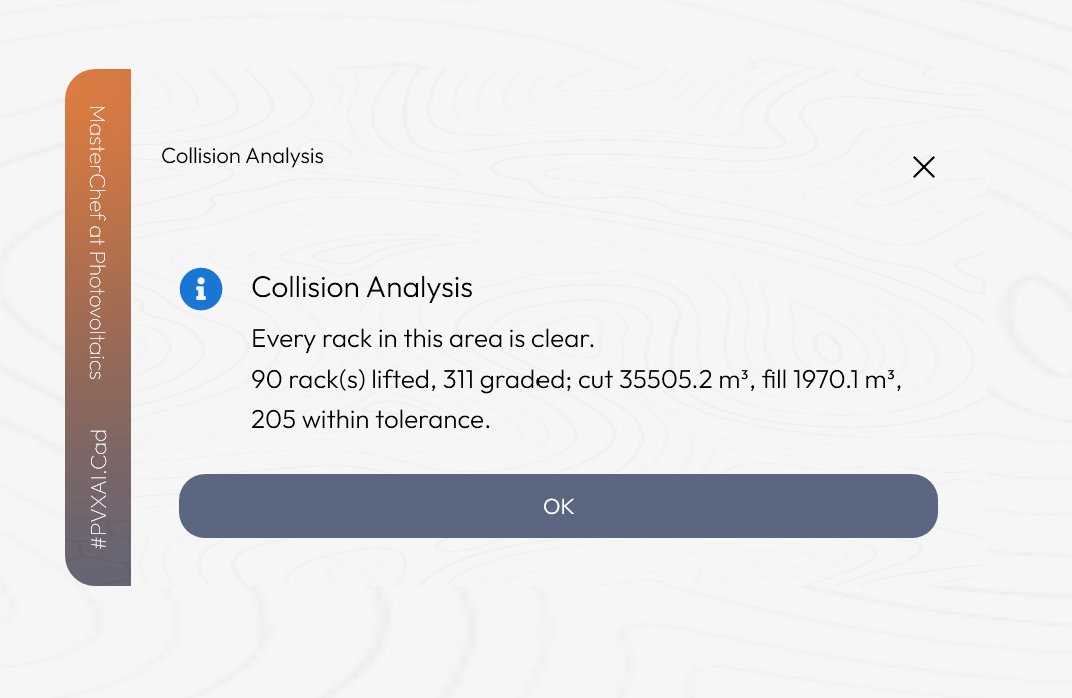
The result. 90 racks lifted with no ground moved, 311 racks whose rows were regraded as one continuous surface, and the cut and fill it cost.
90 racks lifted, 311 graded; cut 35,505.2 m³, fill 1,970.1 m³. The estimate of 40,655 m³ landed about 8 percent above the 37,475 m³ actually moved. Racks with findings the design cannot act on are held and named, never silently modified. In this run there were none.
3. Adapt terrain to piles
For the heaviest cases, the selected racks hand off to targeted terrain adaptation. The ground is corrected under those racks while the rest of the PV area is held as constraints. The findings go stale until you re-run the analysis, and the panel says so.
Where does this sit next to the other grading tools? PVX.Cad has three ways to grade, each for a different problem:
| Grading path | What it does | Where |
|---|---|---|
| Area grading | Smooths a whole PV area to N-S and E-W slope targets with cut and fill balance, and can generate roads in the same run | Grading dialog on the Earthworks panel |
| Pad grading | Cuts a real, level pad under each rack and seats the rack on it | Adapt Terrain to Pile |
| Targeted terrain adaptation | Regrades only the rows with out-of-band piles, as one continuous surface, while the rest of the site is held still | Collision Analysis, Fix collisions |
The collision fix is the third path: the smallest footprint, driven by the findings rather than by a slope target, and still a surface a dozer can cut in passes.
What the fix did to the ground
The cut and fill map after the run shows the footprint of the fix. Earthwork runs along the rack rows that needed it and nowhere else, as continuous bands rather than a scatter of pile pockets. The natural terrain between rows is untouched.
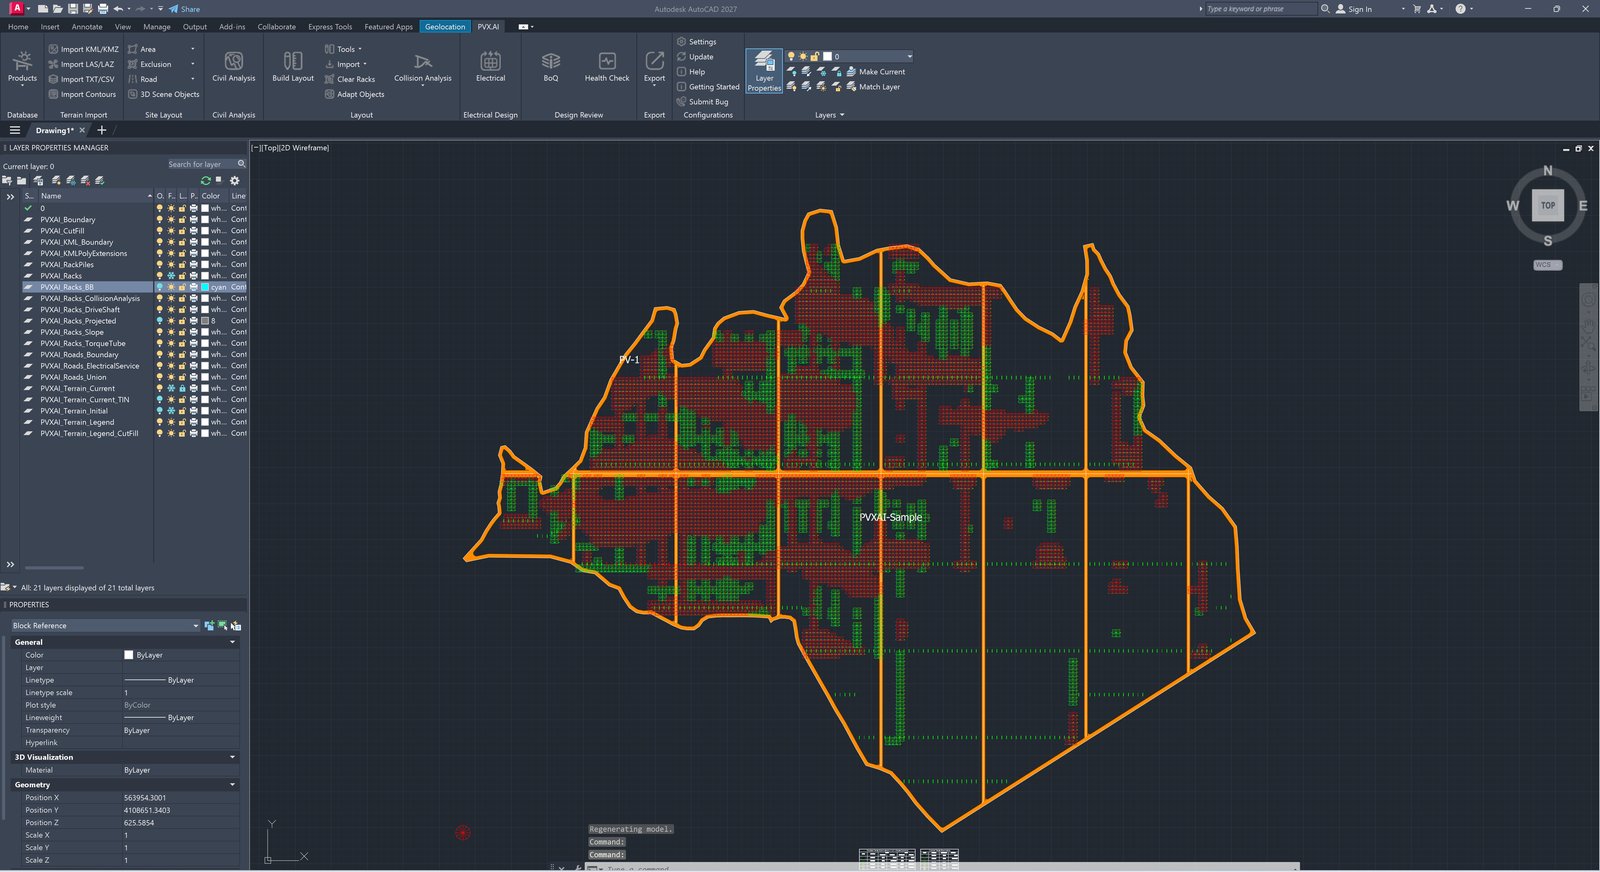
Cut in red, fill in green. Continuous bands along the rows that needed it, and only there.
Drop a section through any row and the change is legible against the natural profile: one graded line, not a staircase.
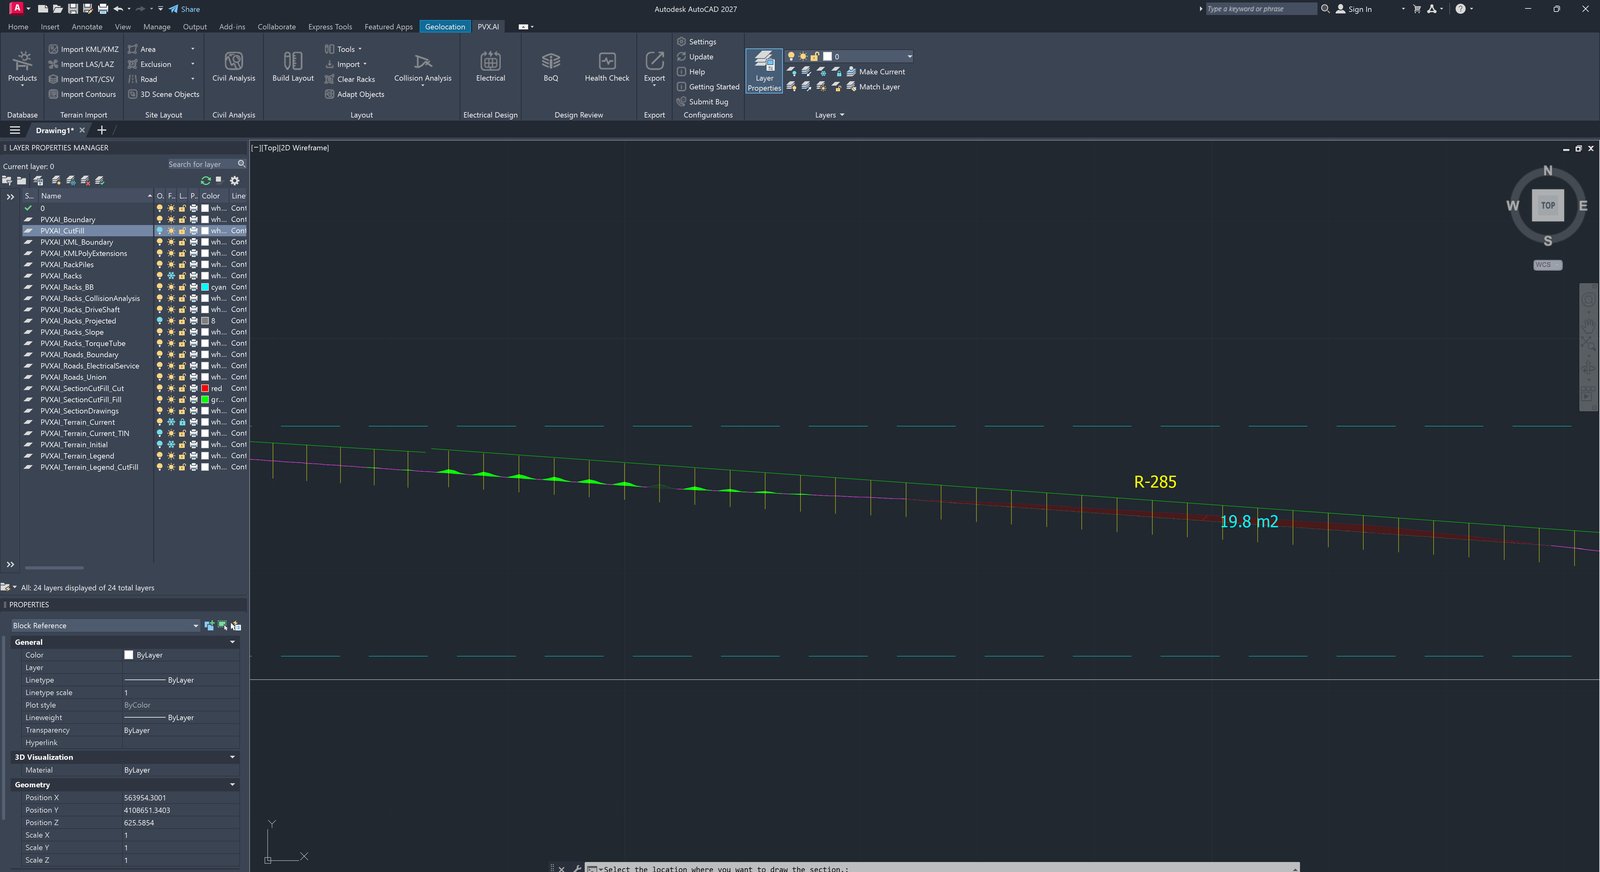
Section through R-285: one continuous graded line against the natural ground, cut and fill shaded, a 19.8 m² area labelled where the design profile leaves the existing ground. This is the profile a bulldozer cuts in passes.
The graded surface is a real TIN. It carries into every downstream quantity: pile lengths, the earthwork take-off, the cable trench profiles.
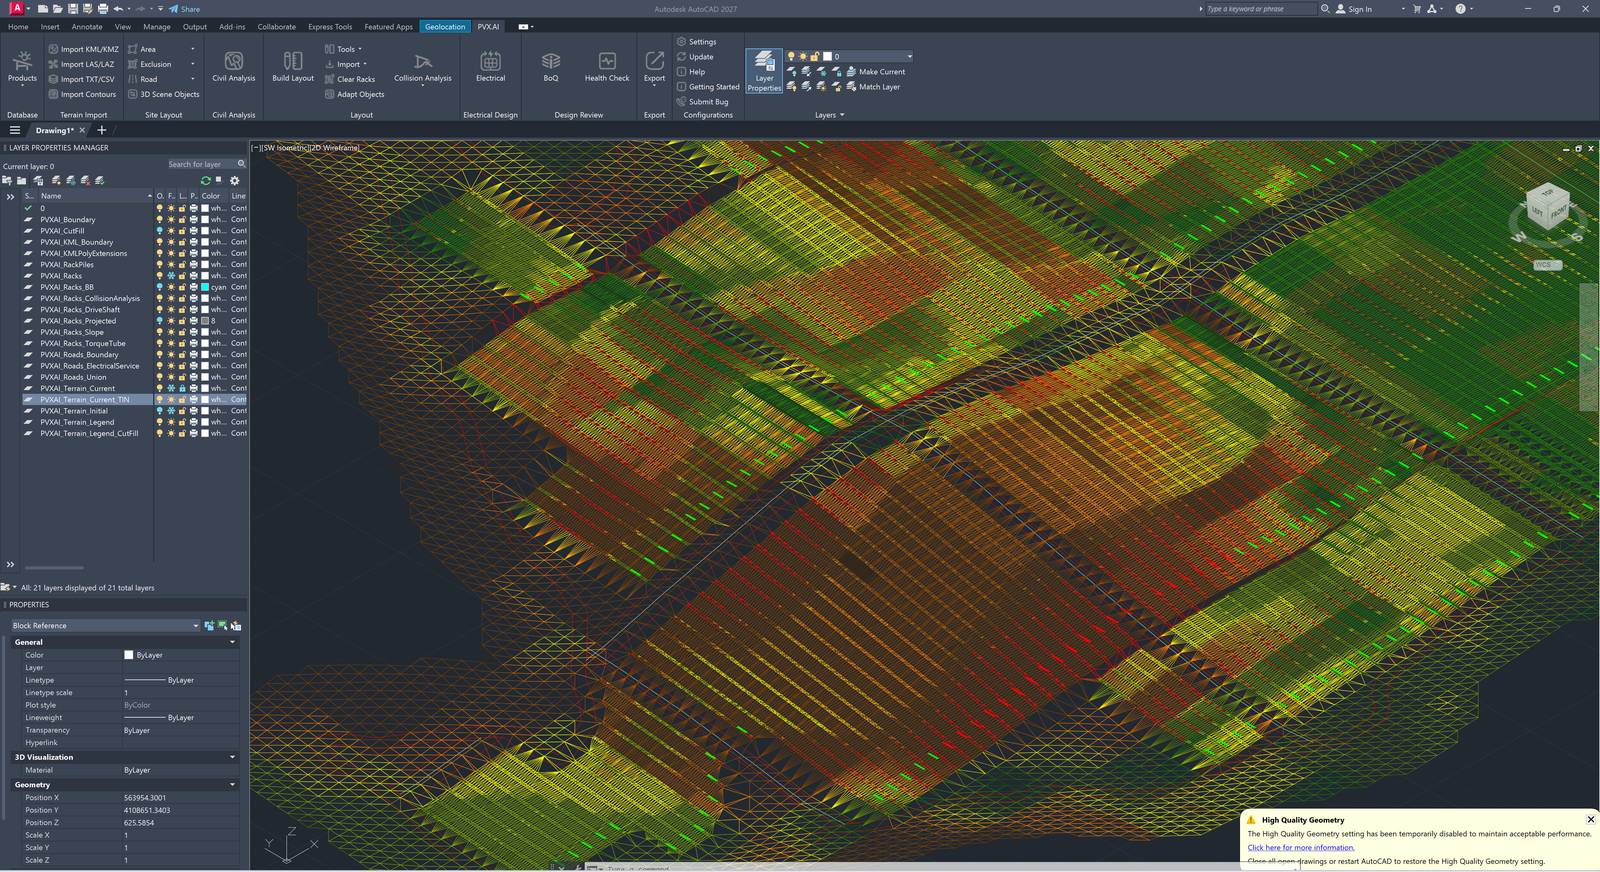
The graded TIN in 3D. What the drawing reports is the surface that will be built.
Re-scan: zero violating
Run the analysis again on the corrected surface and the header changes:
0 of 534 racks violating, 205 marginal, 0 skipped, scanned in 1.5 s.
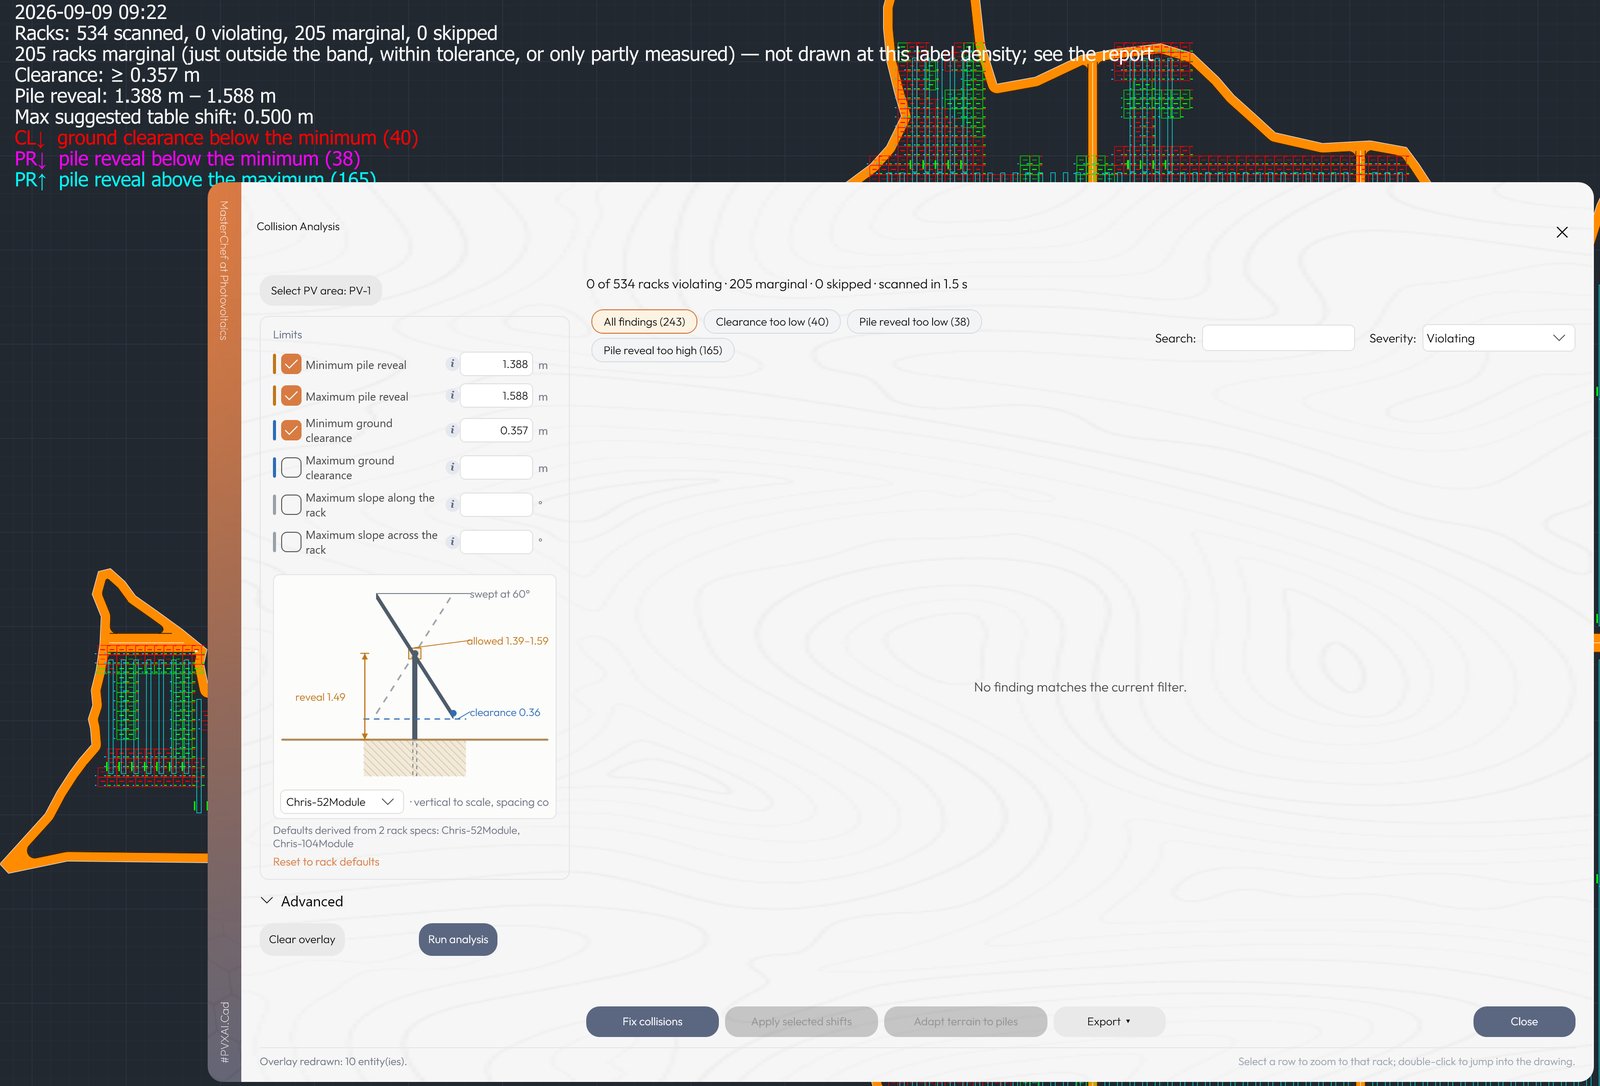
The re-scan. No finding matches the Violating filter. The 205 marginal racks are listed in the report.
Marginal means just outside the band but within tolerance, or only partly measured. The legend counts them (40 on clearance, 38 on reveal too low, 165 on reveal too high) and the report carries every one, so the reviewer sees them rather than a bare green light. Clear means clear against the limits you configured. The reviewer still signs.
When your own limits disagree
Sometimes the band and the floor contradict each other: a clearance floor that needs a reveal the band cannot reach. The panel does not fail quietly. It explains the conflict with the exact numbers and offers one-click remedies, each with its consequence stated: use a wider band and run, raise the maximum reveal, or lower the floor. The resolution becomes an engineering decision instead of a guess.
Two exports for the reviewer
Every scan exports two deliverables. The pile schedule is a CSV with one row per pile and its verdict, ready for the structural reviewer or the pile supplier. The run report documents what the scan measured, the limits it was judged against, and the outcomes.
The point of both is the meeting they replace. Instead of debating whether the north slope rows will hold reveal, the reviewer reads the band, the measured value, and the fix that was applied.
The last gate
Collision Analysis answers one question: will these racks stand on this ground within spec? Design Health Check answers the wider one: is this drawing fit to ship? It is a read-only scan of the whole design that returns a 0 to 100 score with a grade, groups findings by the part of the workflow they belong to, and exports an HTML report or a findings CSV. Run it after the collision fix, before the drawing goes to a client or a site assessment request.
Run it on your own layout
The scan takes seconds and changes nothing until you tell it to. Place a layout, or bring one in: a 2D layout through Import Layout, or a PVcase design imported as native PVX objects. Then select the PV area and run the analysis.
- Start a free trial of PVX.Cad and run it on your own terrain, inside your own AutoCAD.
- Book a demo and bring a DWG. We run the scan and the fix live on your site.
- Read more about collision analysis, the health check, and lightning coverage on the Design Review page, and about the three ways to grade.